KPI Studio
KPI Studio turns pasted data into polished video charts in seconds, eliminating complex animation software and timeline keyframes.
Visit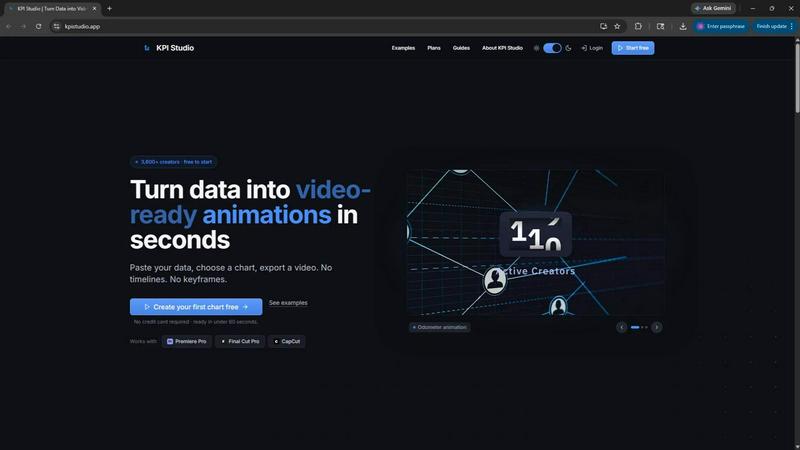
About KPI Studio
KPI Studio is a specialized software tool designed for data-driven video creators who need polished, animated charts and metrics for their content but lack the time or expertise for traditional motion design. The product addresses a fundamental workflow problem: screenshots appear unprofessional, Canva templates are inflexible, After Effects requires hours of keyframing, and hiring freelancers is slow and costly. KPI Studio eliminates this entire process by allowing users to paste their data, choose a chart type, and export a fully animated, video-ready visual in under 60 seconds. There are no timelines, no keyframes, and no complex setup involved. The tool is built for creators operating on a strict publish schedule who need a chart ready today, not tomorrow. Exports include formats with transparent backgrounds, such as MOV with alpha channel, allowing charts to be dropped directly into editing software like Premiere Pro, Final Cut Pro, or CapCut with no additional editing required. For advanced workflows, JSON export enables deeper customization and integration into custom production pipelines. KPI Studio is trusted by over 3,600 creators and offers a free tier to get started.
Features of KPI Studio
Instant Data-to-Video Conversion
KPI Studio transforms raw numerical data into fully animated video graphics in under 60 seconds. Users simply paste their data into the tool, select a chart type from the available options, and export a finished animation. This eliminates the need for any motion design skills, keyframe manipulation, or timeline editing. The process is streamlined into three steps: paste data, customize the chart, and export for video. If data changes, users can simply re-export without redoing any work.
Video-Ready Export Formats
The tool provides multiple export formats specifically designed for video editing workflows. Users can export as MP4 for standard video, MOV with transparency for direct overlay in editing timelines, GIF for simple animations, and PNG sequences for frame-by-frame control. The transparent background option is critical for video editors because it allows charts to be placed over existing footage without any additional masking or compositing work. Exports are available in multiple aspect ratios including 16:9 widescreen, 1:1 square, 9:16 stories, and 4:3 standard.
Animated Chart Types
KPI Studio offers a range of animated chart types suitable for different data visualization needs. Count-up numbers animate milestone metrics like subscriber counts or revenue totals, with numbers changing dynamically on screen. Growing bar charts reveal comparisons across competitors or time periods as bars rise smoothly. Drawing line charts show trends like revenue growth or audience changes as a self-drawing line. These animations are designed to be engaging and professional without requiring any custom animation work from the user.
Advanced JSON Export for Custom Pipelines
For creators with more sophisticated workflows, KPI Studio provides JSON export functionality. This allows users to access the underlying chart data and animation parameters in a structured format that can be further edited or integrated into custom production pipelines. This feature is particularly valuable for teams that need to automate chart generation, apply brand-specific styling programmatically, or feed chart data into other tools for additional processing. It bridges the gap between rapid creation and deep customization.
Use Cases of KPI Studio
YouTube and Social Media Content Creation
Video creators producing content for YouTube, Instagram, TikTok, and other platforms use KPI Studio to add professional data visualizations to their videos. Whether it is showing subscriber growth, revenue milestones, or engagement metrics, the tool allows creators to quickly generate animated charts that enhance viewer understanding and retention. The transparent background exports ensure that charts can be placed over any video background without awkward cropping or editing. This is especially valuable for creators who publish weekly and cannot afford to spend hours on a single chart.
Business Presentations and Reporting
Professionals preparing presentations for PowerPoint or Google Slides use KPI Studio to create animated data visuals that are more engaging than static charts. The tool enables sales teams to show quarterly growth, product managers to demonstrate feature adoption, and executives to present key performance indicators with dynamic visual impact. The ability to export in multiple formats ensures compatibility with various presentation platforms, and the quick turnaround time means last-minute data updates are not a problem.
eLearning and Educational Content
Educators and instructional designers use KPI Studio to create animated data visualizations for online courses, training modules, and educational videos. The tool helps explain complex data trends, compare historical figures, or demonstrate statistical concepts in a visually engaging way. Animated charts hold viewer attention better than static images, and the straightforward workflow means instructors can focus on content quality rather than technical animation skills. The transparent background feature is particularly useful for integrating charts into existing training video templates.
Client Reporting and Agency Work
Marketing agencies and freelancers use KPI Studio to produce polished, animated reports for clients. Instead of sending static PDFs or screenshots, they deliver video-based reports that showcase campaign performance, website analytics, or social media growth with professional animations. The tool significantly reduces the time required to produce client deliverables, allowing agencies to handle more projects without expanding their team. The one-time Creator Pack pricing is ideal for agencies that need occasional exports for specific client projects.
Frequently Asked Questions
What makes KPI Studio different from using After Effects or similar software?
KPI Studio is designed specifically for rapid data visualization, not general motion graphics. While After Effects requires a steep learning curve, hours of keyframe manipulation, and a full Creative Cloud subscription for a simple chart animation, KPI Studio delivers the same result in under 60 seconds with no motion design skills required. Any data change in After Effects means redoing keyframes, but with KPI Studio, users simply re-export. The tool is purpose-built for creators who need charts in every video but cannot afford the time investment of traditional animation software.
Can I use KPI Studio exports directly in my video editing software?
Yes. KPI Studio exports video files with transparent backgrounds, specifically MOV with alpha channel, that can be dropped directly into Premiere Pro, Final Cut Pro, CapCut, and other major video editors. There is no need for additional editing, masking, or compositing. The chart is ready to use the moment you click export. The tool also supports MP4, GIF, and PNG sequence formats for different workflow needs, ensuring compatibility with virtually any editing environment.
What kind of data can I visualize with KPI Studio?
KPI Studio supports a range of common data visualization types including count-up numbers for milestone metrics, growing bar charts for comparisons, and drawing line charts for trends over time. Users can visualize subscriber counts, revenue totals, engagement metrics, competitor comparisons, audience growth, and any other numerical data that benefits from animated presentation. The tool is designed for straightforward data input, so complex datasets are not required. Simply paste your numbers, choose the chart type, and export.
Is there a free version of KPI Studio and what does it include?
Yes, KPI Studio offers a free tier that requires no credit card to start. The free plan includes unlimited PNG exports, three free animated video exports, access to all chart types, and real-time preview of your charts. This allows creators to test the tool on their next video without any financial commitment. For users who need more exports, there is a one-time Creator Pack for occasional projects and a monthly Pro subscription for unlimited exports at 4K resolution without watermarks.
Pricing of KPI Studio
KPI Studio offers three pricing tiers to accommodate different usage levels. The Free plan costs $0 per month and includes unlimited PNG exports, three free animated exports, all chart types, and real-time preview. The Creator Pack is a one-time purchase of $11.99 and includes everything in the Free plan plus 10 video exports in GIF, MP4, WebM, and MOV formats, no watermark, and 1080p export resolution with no expiry on credits. The Pro plan is the most popular option at $19.99 per month and includes everything in the Free plan plus unlimited video exports in all formats, no watermark, 4K export resolution, and the ability to cancel anytime.
Similar to KPI Studio
Ribbi is a self-evolving AI agent that automates social media content creation and growth across video, visuals, audio, and performance tracking.
ChatGPT Image 2 is a versatile AI platform for seamless image editing, generation, and video creation, now at 50% off for a limited time.